

Results
See what recovery produced and how much of your margin the discounts used, who leaves carts and where, what each segment's follow-ups add week by week, and whether your setup is healthy.
Results → Performance shows what recovery produced on every store. Stores with customer segments also get the Overview tab, Results → Cohorts and the Program health panel.
See what recovery earned and cost#
Results → Performance shows what recovery produced, and how much of your margin the discounts used. Switch between 7 days, 30 days and 90 days. On stores with customer segments you can see the whole store or one segment.
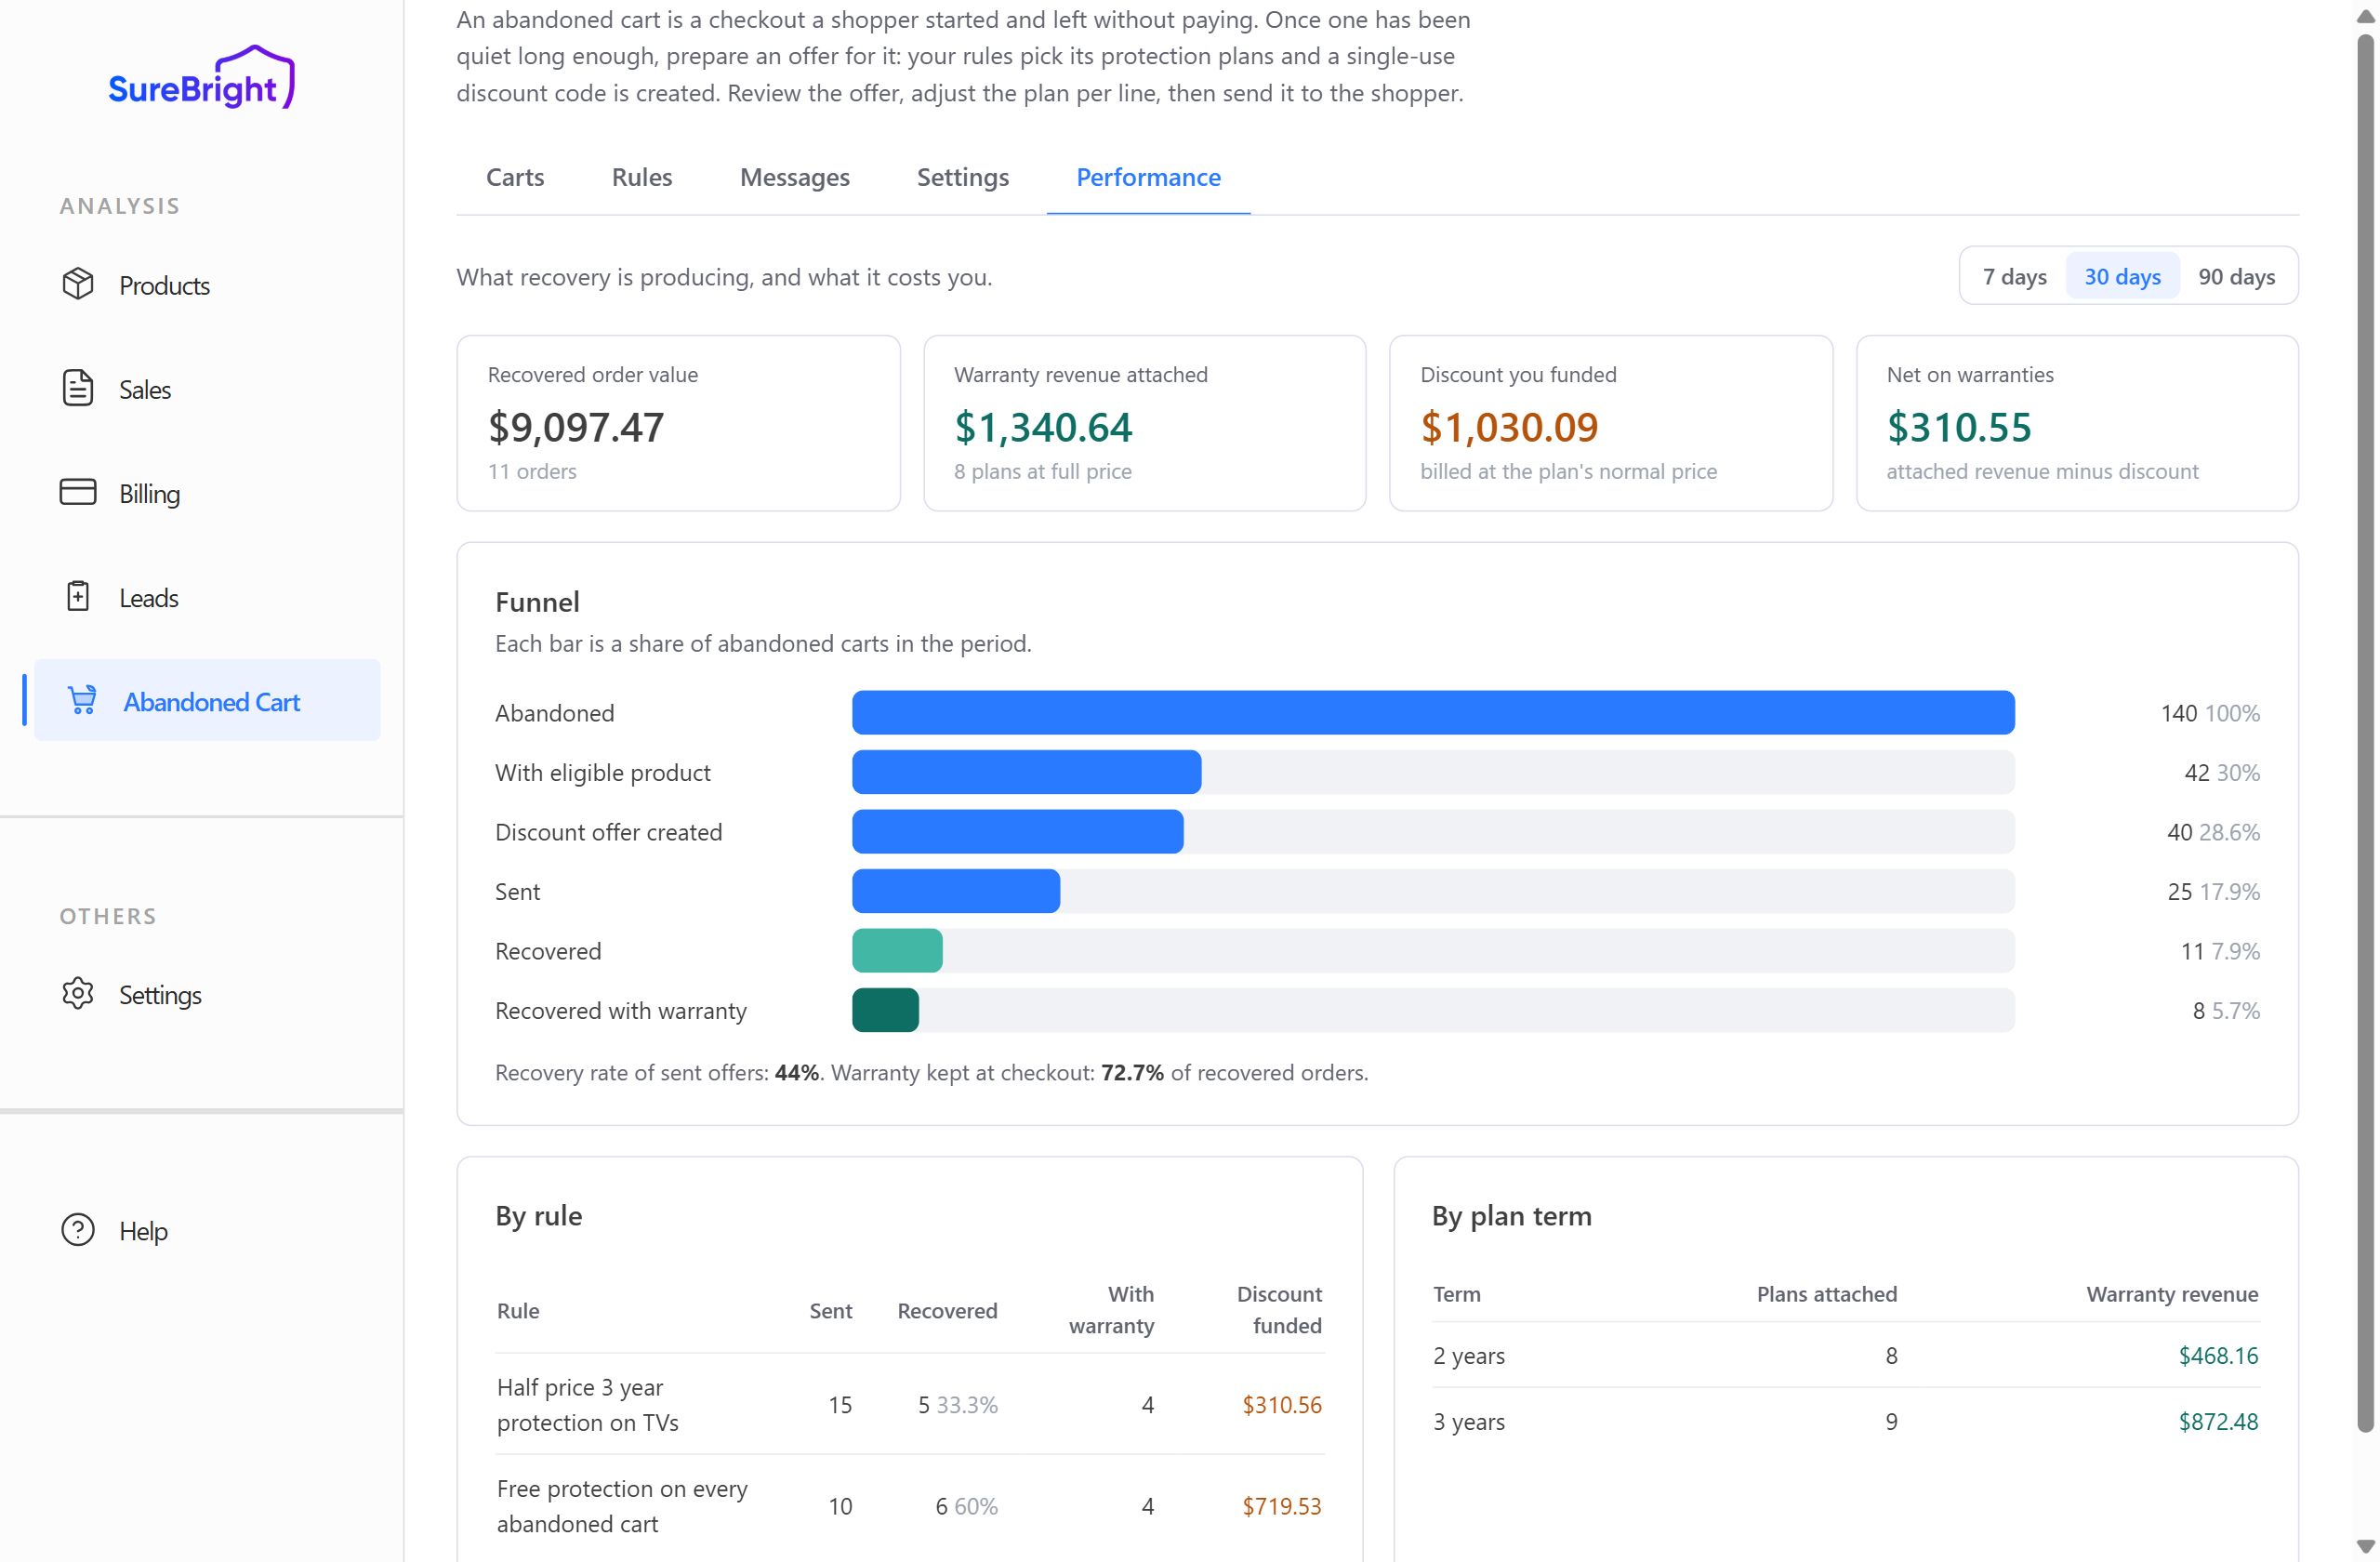
The four figures at the top:
The Funnel shows each stage as a share of abandoned carts in the period: abandoned, how many had a product that could be covered, how many got an offer, how many were sent, how many came back, and how many kept the plan. By rule (or By customer segment) and By plan term show which offer and which plan length are actually working.
See who leaves carts and where#
The Overview tab tells you what your store's carts say and what to try next.
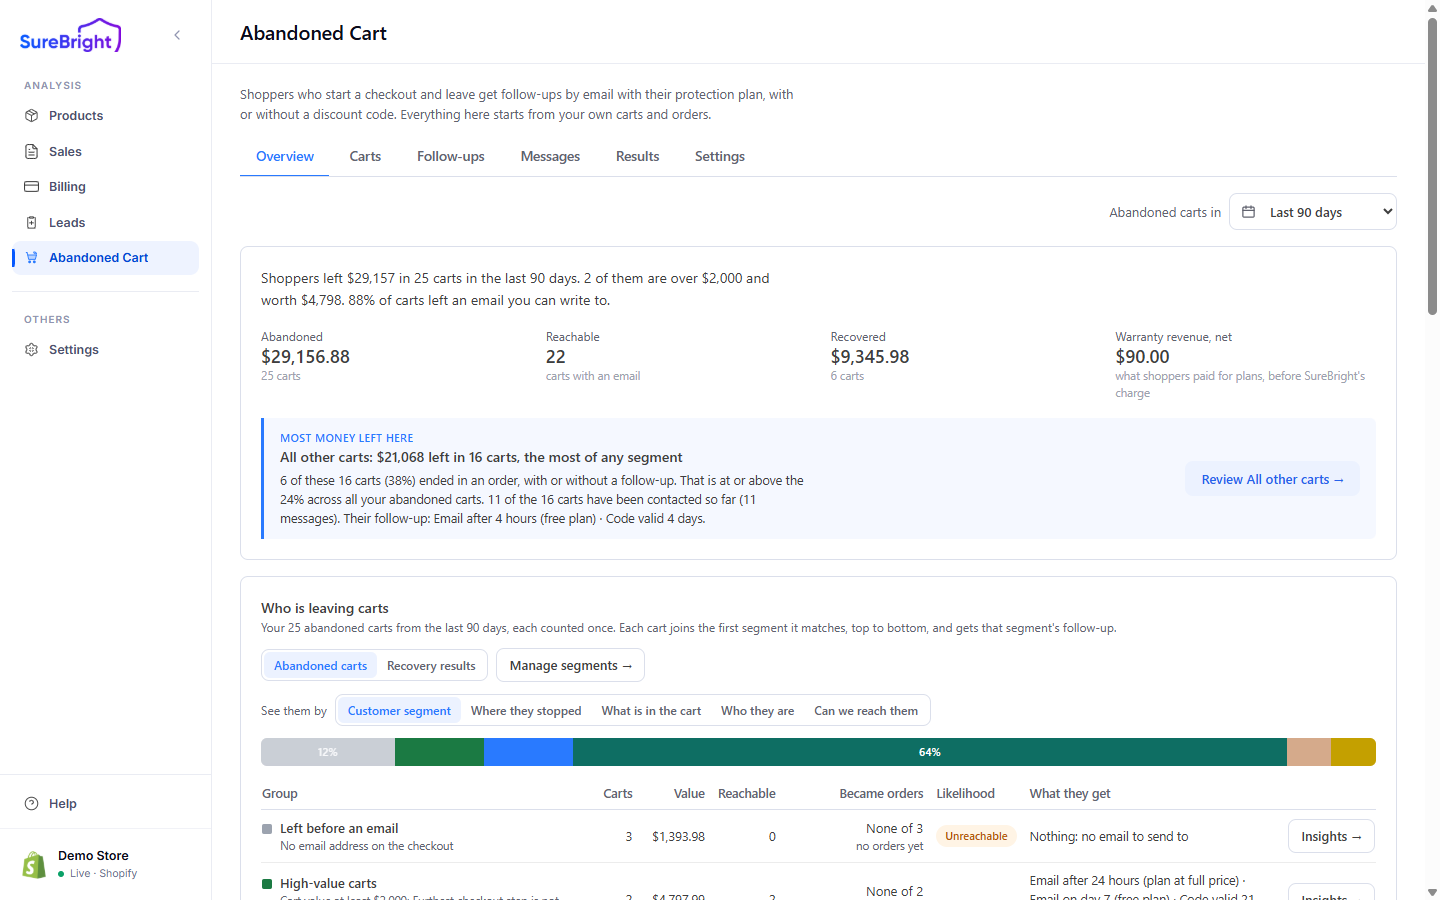
Switch Abandoned carts to Recovery results to see each segment's recovered carts and value by month.
Measure what your sequence adds#
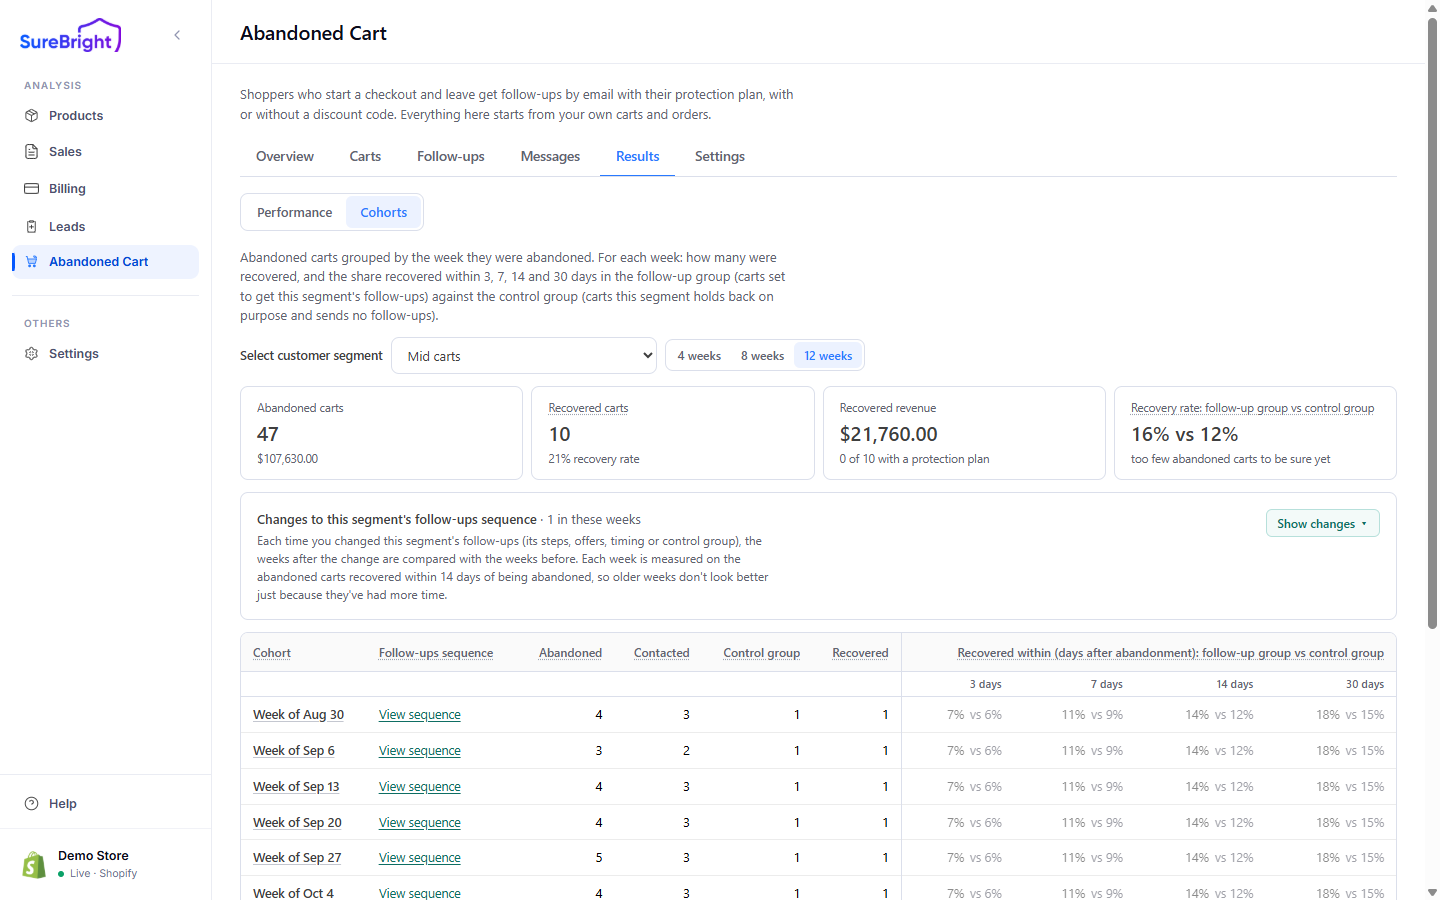
Results → Cohorts groups abandoned carts by the week they were left (Monday to Sunday) and shows, for each week, how many were Contacted, how many were in the Control group, how many were Recovered, and the share recovered within 3, 7, 14 and 30 days for the follow-up group against the control group. The difference between the two groups is the measured effect of your sequence. Pick the segment and 4, 8 or 12 weeks at the top. A row reading Segment created on …: its follow-ups start here. marks where the segment's follow-ups begin, and similar rows mark each change.
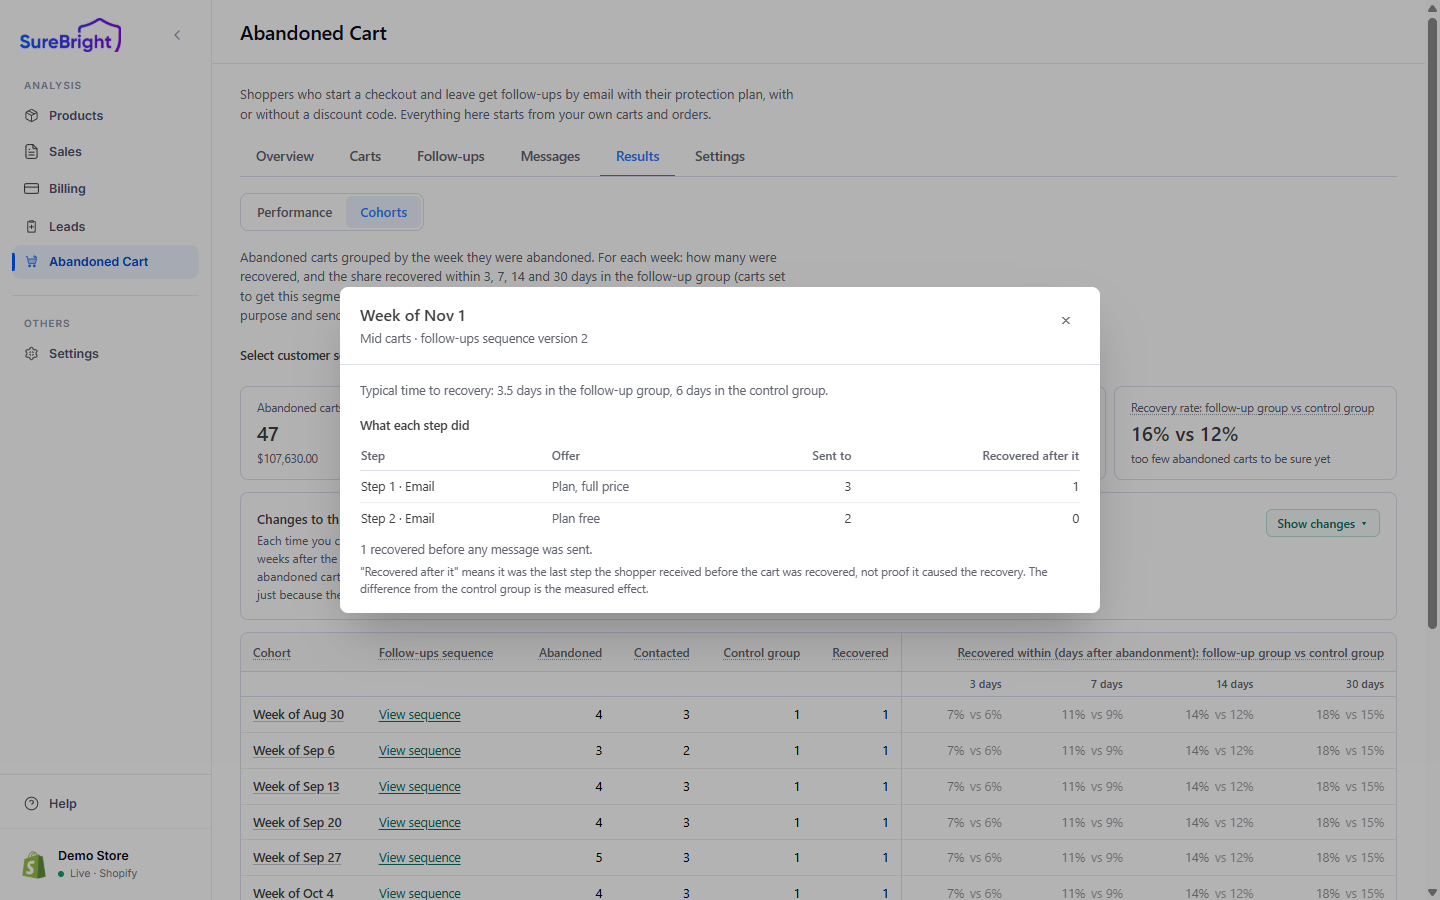
Click a week's name to see what each step did that week: how many shoppers each step was sent to, and how many recovered after it. Recovered after it means it was the last step the shopper received before buying, not proof that it caused the purchase; the difference from the control group is the measured effect.
View sequence beside a week shows the exact sequence that was live then: its version, when it started, what changed, each step with its timing, offer, message and label, how long the code lasted and the control group.
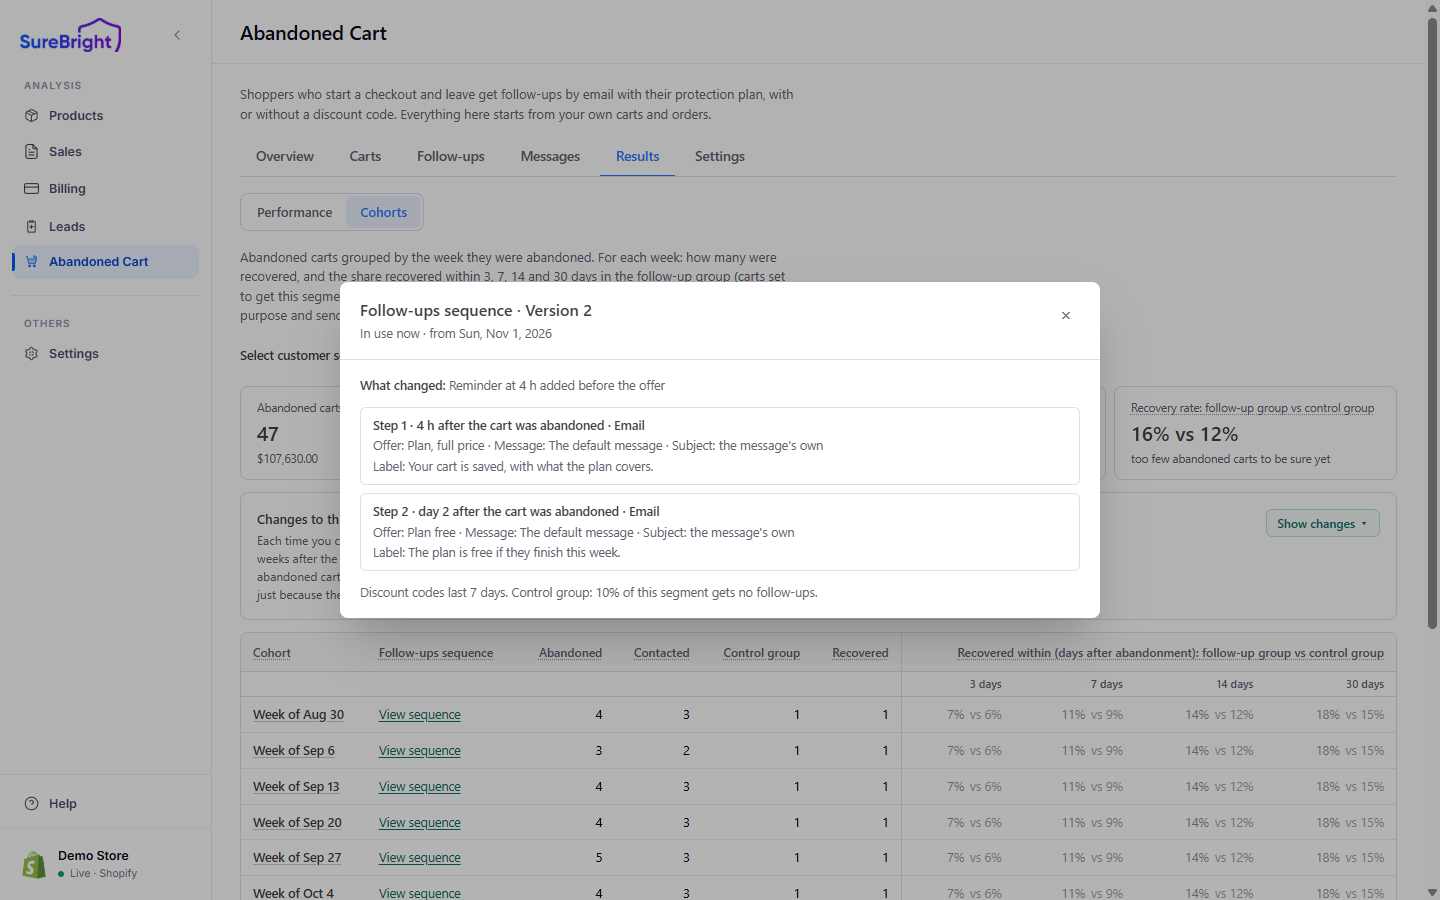
Changes to this segment's follow-ups sequence lists each time you changed the sequence and compares the weeks before and after. Each week is measured on carts recovered within 14 days, so older weeks don't look better just because they've had more time. Weeks with a change part-way through, or an A/B test running, are left out of the comparison.
Check your setup with Program health#
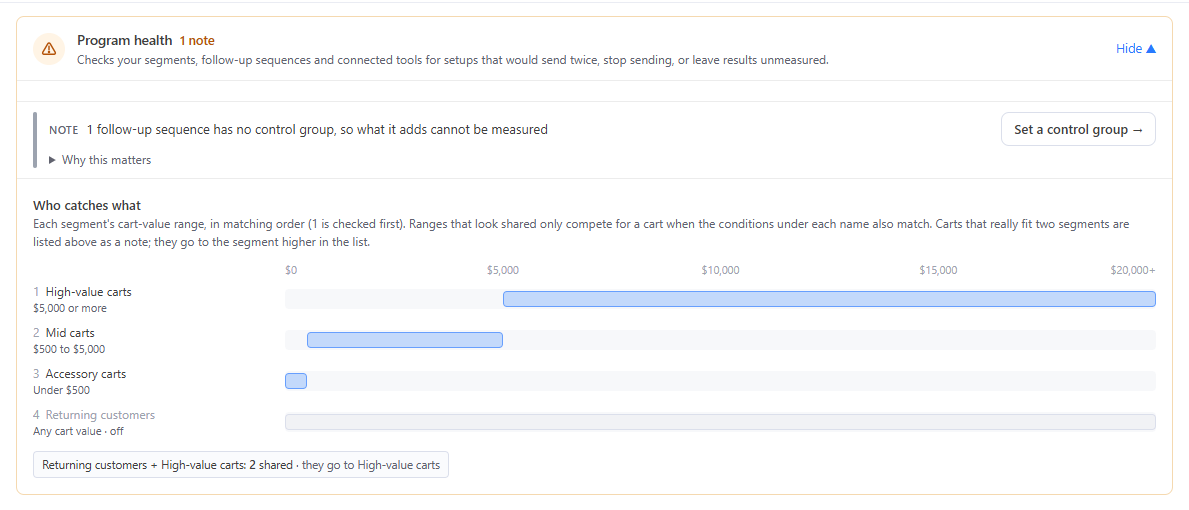
The Program health panel, above your segment list on Follow-ups → Customer segments, checks your segments, sequences and connected tools for setups that would send twice, stop sending, or leave results unmeasured. Each finding is a Blocker, a Check or a Note with Why this matters. Who catches what draws each segment's cart-value range in matching order so you can see where two segments compete for the same carts. All clear reads: no two segments share carts, every step's tool is connected, no step sends an expired code, and only one sender writes to each shopper.